
Specifications
| Frequency range |
Agilent 4294A Precision Impedance Analyzer: 40Hz - 110MHz Novoncontrol Alpha-A High Resolution Frequency Analyzer: 3μHz – 40MHz |
| Temperature range |
Cryovac He-Konti Magno Cryostat: 2K – 325K |
| Magnetic field range |
Oxford Spectromag Superconducting Magnet: - 9T – + 9T |
| Pressure range |
Almax easyLab Diamond Anvil Pressure Cells: 0GPa – 15GPa |
| Voltage range |
Novocontrol HVB 300 High Voltage Interface: 150V aixACCT TF Analyzer 2000 + 400V High Voltage Amplifier: 400V |
General Description


Principle
The primary quantity being determined is the complex dielectric permittivity Ԑ* = Ԑ´ + i Ԑ". There are plenty of approaches in measuring Ԑ* of the sample, with feasibility depends on the favoured frequency range and sample conditions. One of the most intuitive and widely deployed approach is the auto-balancing bridge method, in which the crystal is sandwiched by electrodes and its complex admittance Y = G + iB is measured by a balanced bridge circuit.
With the admittance and geometric factor of the sample known, other electrical quantities can subsequently be calculated, such as the conductivity (Fig. 4) and the dielectric permittivity (Fig. 5). Dielectric spectroscopy simultaneously probe the conduction and dipolar polarizations in the sample, and so it can provide a consistent overview of the electronic nature of the system.


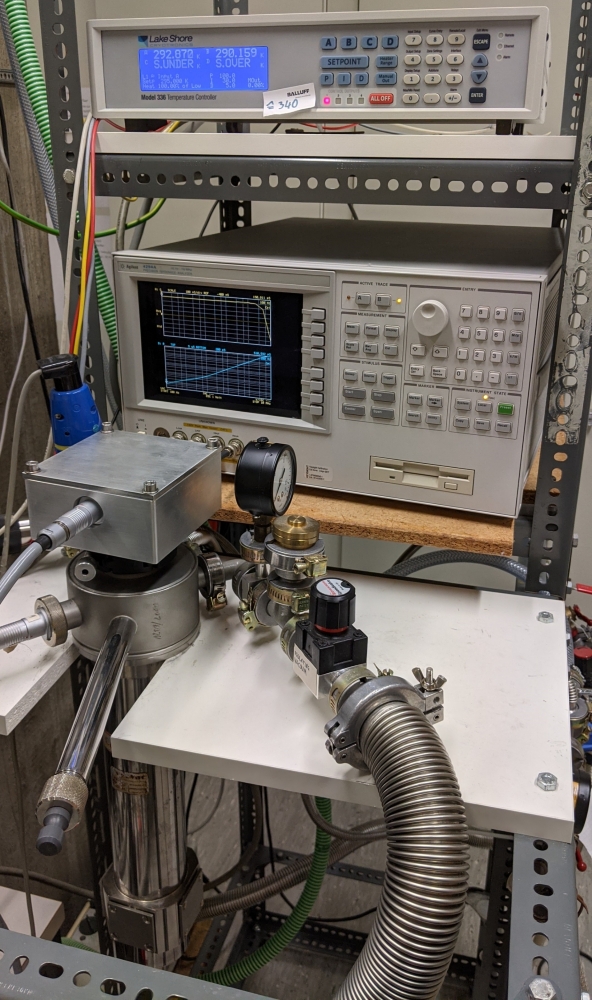
Integration with external stimuli
The microscopic origin of the electronic properties can be dissected by tracking down their evolutions with the environment, e.g. under magnetic field and under physical pressure. Our laboratory is well-equipped with external stimuli devices (Fig. 6-8), allowing a comprehensive study of the material properties under extreme conditions. On top of that, these stimuli can be incorporated and operated simultaneously, namely, multiple extreme conditions can be realised in case of any interest.
References
[1] F. Kremer and A. Schönhals, eds., Broadband Dielectric Spectroscopy. Springer Berlin Heidelberg, 2003.
[2] Y. T. Chan, S. Roh, S. Shin, T. Park, M. Dressel, and E. Uykur, “Three-dimensional hopping conduction triggered by magnetic ordering in the quasi-one-dimensional iron-ladder compounds BaFe2S3 and BaFe2Se3,” Physical Review B, vol. 102, jul 2020.