Detailed Description of THz Frequency domain spectroscopy
With our THz frequency-domain spectrometer [1] we are able to perform direct and quantitative measurements [2-5] of the dielectric spectra of materials, i.e., the real and imaginary parts of the electrodynamic response functions like complex complex refractive index (n + ik), complex dielectric permittivity, complex conductivity, surface resistance/reactance (RS + iXS), etc.
The measurements can be performed in the frequency range 1 - 40 cm-1 (i.e., 30 - 1200 GHz, which corresponds to an energy range 0.1 - 5 meV or to a wavelength of 250 – 10000 mm) at temperatures T = 2 - 300 K. We also possess the facilities to perform the experiments in an external magnetic fields up to 8 T (Oxford Spectromag 4000) and at elevated temperatures up to 1000 K (home-made ovens). The measurements are fully computer-controlled and rapidly done in a real-time scale.
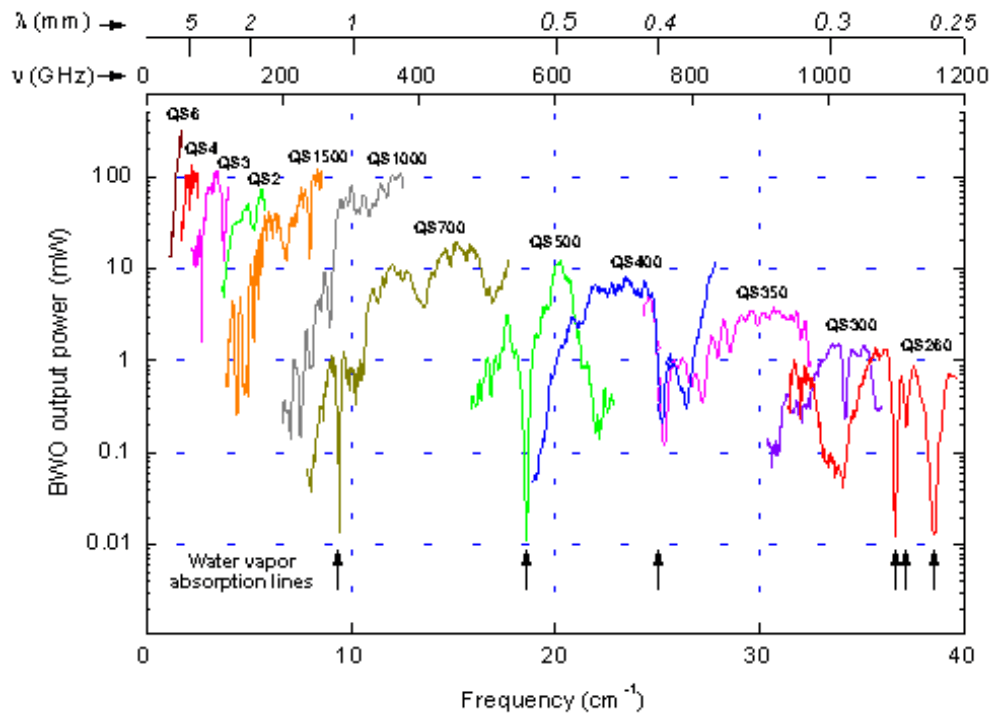
As sources of the electromagnetic radiation the spectrometer utilizes powerful backward-wave oscillators (BWOs). BWOs produce monochromatic and highly polarized radiation and can be continuously tuned in frequency over a wide range. The whole range from 1 to 40 cm-1 is covered by 12 different BWOs as shown in Fig.1.
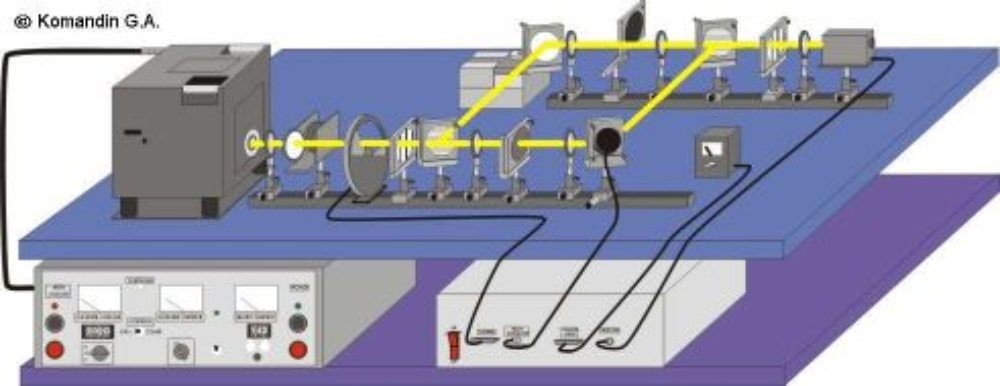
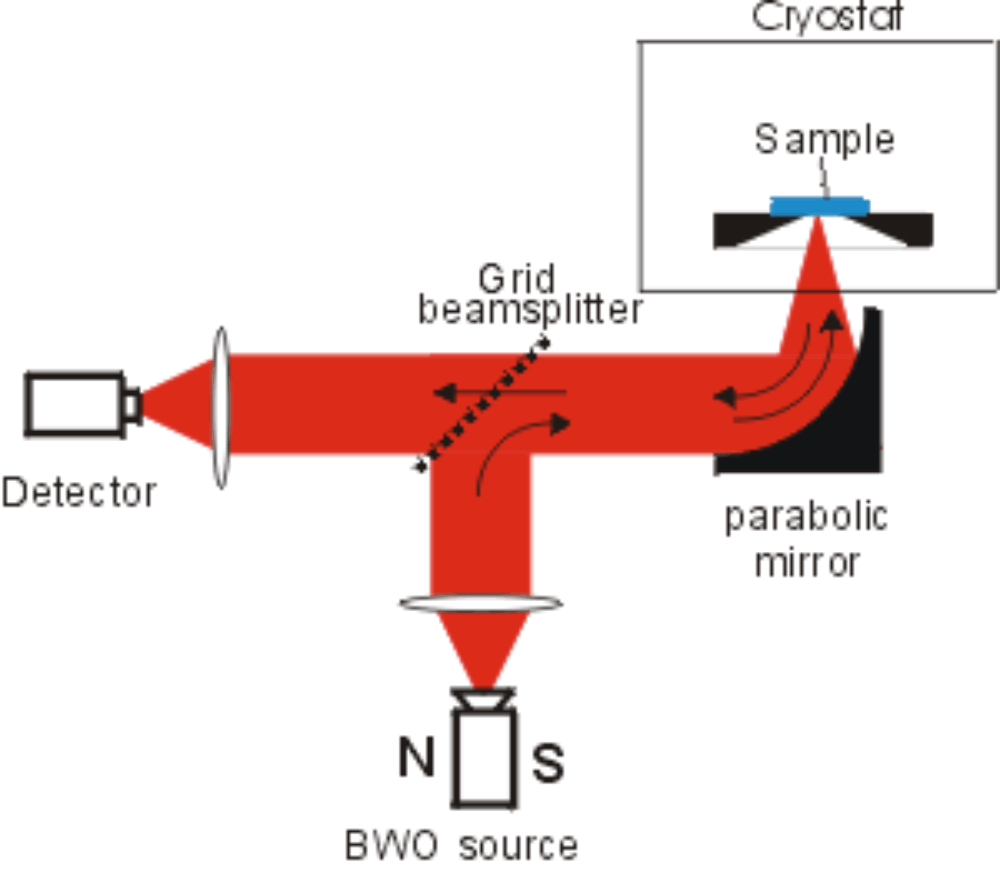
The measurement scheme is a standard optical setup: The radiation generated by the BWO is collimated into a parallel beam by a Teflon or polyethylene lens; it propagates through free space and is finally measured by the detector. Plane wire grids made out of thin tungsten wires spaced at a distance much smaller than the radiation wavelength are used as polarizers, analyzers, semi-transparent mirrors and beam-splitters. The radiation is focussed on the sample by a Teflon or polyethylene lenses. For measurement of the transmitted power only the “red part” of the spectrometer (see Fig.2) is employed and the signal on the detector is recorded versus frequency two times – without and with the sample. The absolute transmission coefficient is determined as a ratio of the two correspondent data arrays. To measure the phase shift all elements of the spectrometer are used forming a Mach-Zehnder two-beam polarization interferometer. One of the mirrors of the interferometer can be moved; its position is controlled by an electronic feedback system in such a way that during the frequency scanning the interferometer is always kept in a balanced state (equal optical paths in its both arms). The quantity measured in this phase-shift mode is the position of this movable mirror Δ(ν). Again, the frequency is scanned twice – without and with the sample – and the phase-shift spectrum is determined on the basis of the correspondent difference Δ(ν)-Δ0(ν).
The BWO frequency ν can be tuned by scanning the applied high voltage and can be precisely measured with quasioptical tunable Fabry-Perot resonators. We use power supplies providing tunable high voltage up to 6 kV, with noise, ripples and short-term deviations not exceeding 10-15 mV leading to the output frequency stability of Δν/ν=10-5-10-6.
The lock-in registration system includes the radiation detector (Golay cell or He-cooled bolometer) and sampling-storage-reset electronics. The dynamic range of the registration system is about 104, which (together with the dynamic range of the quasioptical attenuator unit) provides a full dynamic range of the spectrometer of 106-107.

The idea of the THz dielectric measurements is based on measurement of the spectra of two quantities characterizing the interaction of the electromagnetic field with a plane-parallel sample: the power transmission coefficient Tr(ν) and the phase shift φ(ν) of the radiation upon transmission through the sample. This allows one to determine the dielectric properties of the sample directly, without using the Kramers-Kronig procedure. The mathematical relationships connecting Tr and φ with the dielectric parameters of the sample n and k (or ε', ε", σ, etc.) are well known and can be found in any textbook on optics or electrodynamics [2]. After the Tr(ν) and φ(ν) spectra are measured, the dielectric spectra n(ν), k(ν) of the sample are calculated directly by solving the set of two equations with two unknowns (n and k), at each frequency in the chosen range.
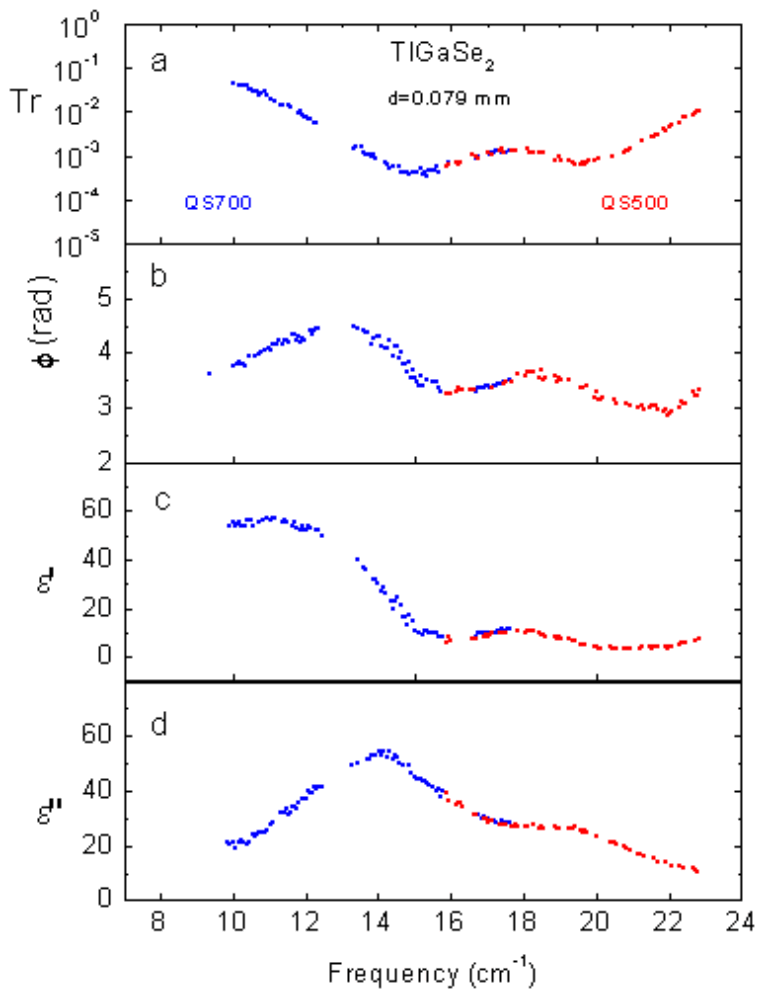
Fig. 4 shows an example of how the dielectric parameters (the real and imaginary parts of dielectric permittivity) can be determined by measurement of the transmissivity and the phase shift of a plane-parallel sample. Namely, the THz spectra of the transmission coefficient Tr(ν) and phase shift φ(ν) of a 79 mm thick plane-parallel plate of TlGaSe2 single crystal (T=300 K, [1]) and of real ε'(ν) and imaginary ε"(ν) parts of dielectric permittivity calculated from Tr and φ. All other dielectric parameters of TlGaSe2 can be also calculated. The spectra were taken using two different BWOs (as shown by different colors).
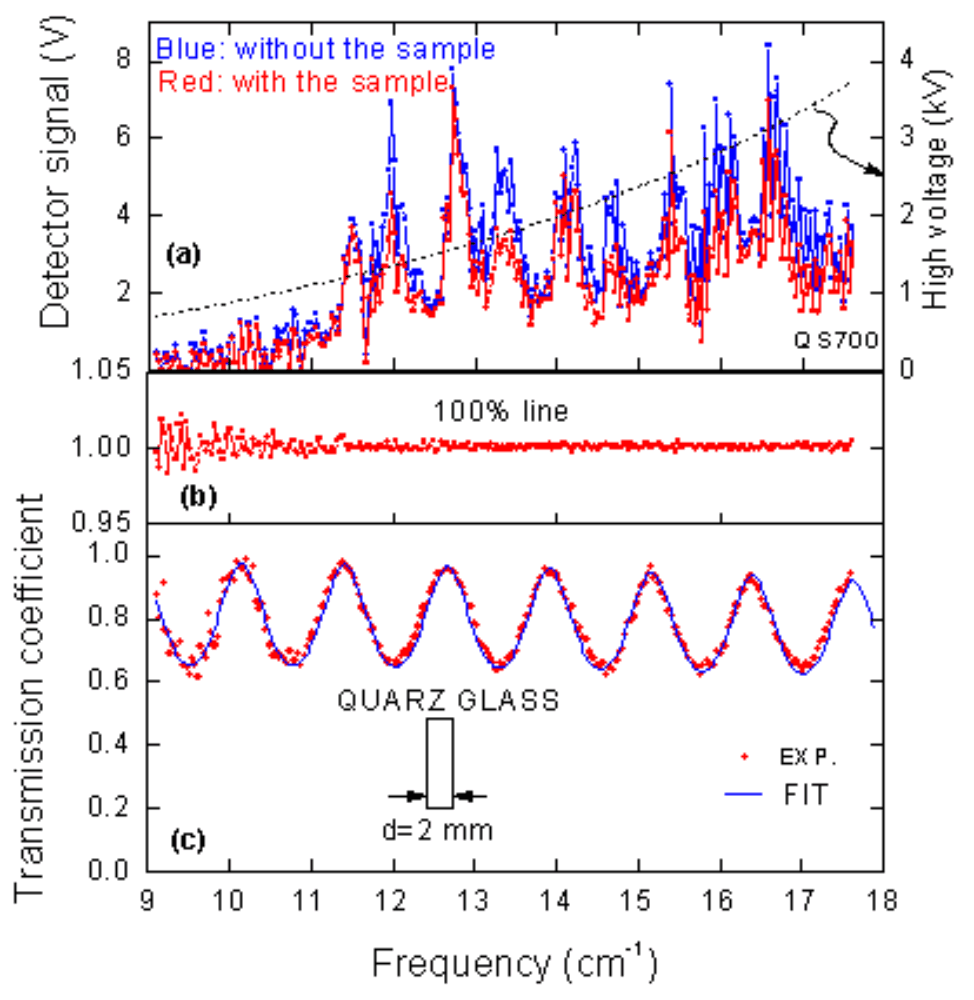
The method of the THz measurement can be done simpler and more rapidly, if the samples are transparent for the THz radiation to an extent that interference fringes can be observed in the transmission coefficient spectra in the form of periodic maxima. These maxima appear due to multiple reflections of the radiation inside the sample, which in this case serves as a multibeam dielectric-filled Fabry-Perot resonator.
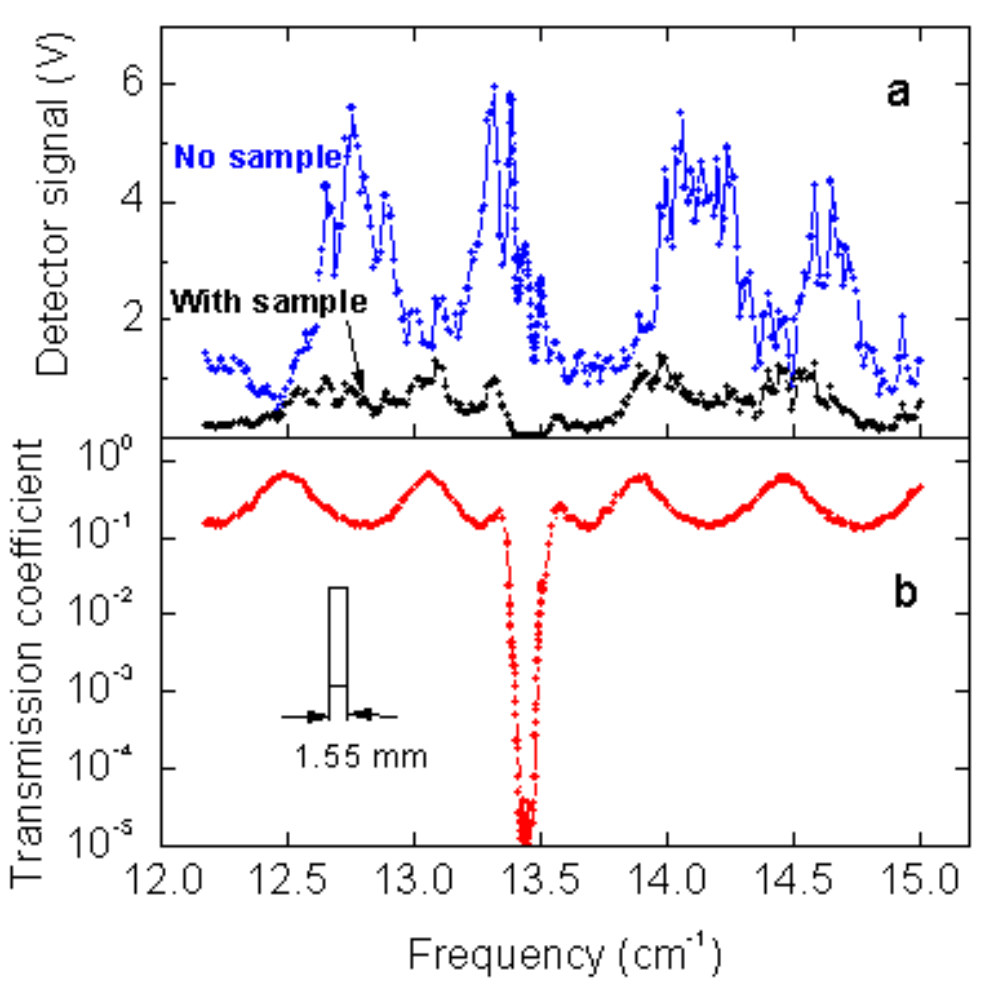
An example of such spectrum is shown in the Fig. 5 and another example in Fig. 6, where a deep minimum is superimposed on interference pattern corresponding to a magnetic mode.
It can be easily shown [2] that the frequency difference between the maxima is determined by the refractive index n and the thickness d of the sample via mλ=2nd, where m is the order of the interference and λ is the wavelength of the radiation. The amplitudes of the interference maxima is given by the extinction coefficient k. This allows the determination of both n and k by a least-square-fit of the data using the expression which describe the transmissivity of a plane-parallel layer to the measured spectrum. No extra phase measurement is required; however it may improve the accuracy of the fit.
The schematic diagrams of the THz spectrometer are shown in Fig. 2 and its layout in Fig. 3.
By this method, practically any material can be measured as long as the power of the THz radiation which penetrates the sample (transmission coefficient) is at the level of 10-4 (with the Golay cell as the detector) or 10-6 - 10-7 (using a He-bolometer). Assuming that the bulk sample can be polished down to the thickness of about 10 microns (see for example [3,4]) then the values ε',ε" ≈ 1000 (σ ≈ 100 - 300 Ohm-1cm-1) are accessible for measurements by the THz spectrometer in the transmission geometry with the average accuracy ∼5% for ε' and ∼10% for ε".
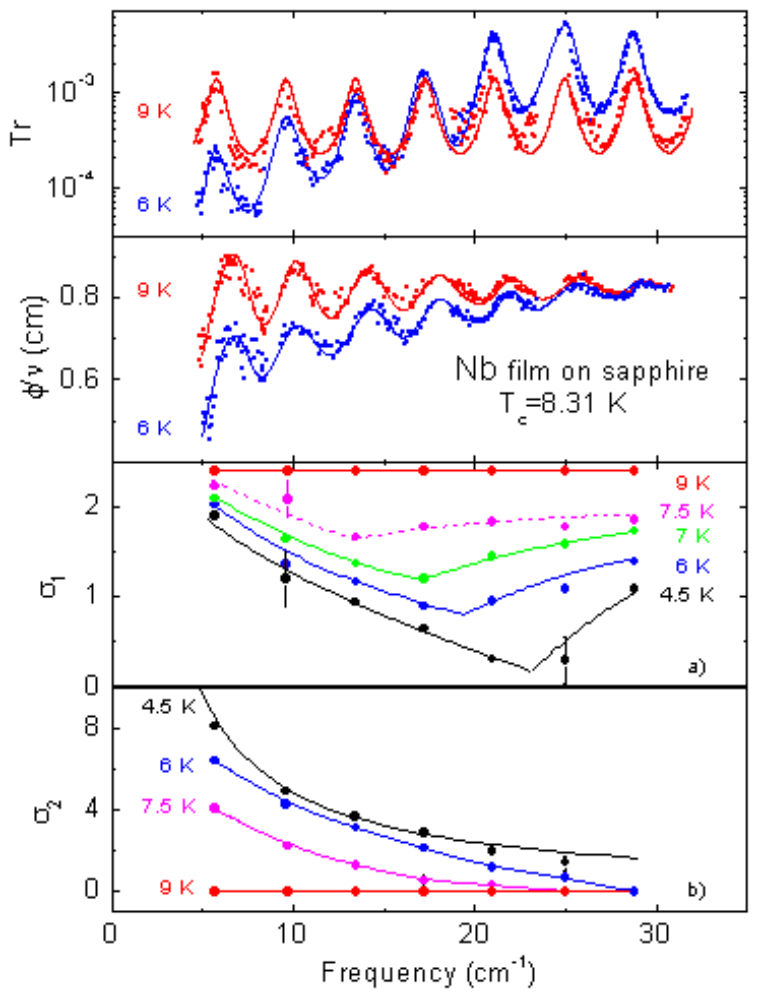
In Fig. 7, the THz transmissivity and phase shift spectra for Nb film (150 Å) on Al2O3 substrate (0.45 mm) at two temperatures, corresponding to the normal and superconducting states of the film (two frames at the top) are shown.
The two bottom frames show the spectra of the real and imaginary parts of conductivity (in Ohm-1cm-1) of the film, calculated from the transmission coefficient and phase spectra [5].
When needed, instead of the transmissivity, direct reflectivity measurements can be performed utilizing the spectrometer. The corresponding layout is presented in the Fig. 8.
Measurements of transmission and phase shift allow also determining the spectra of conductivity and permittivity of thin films on transparent substrates (two layer systems). Since films often can be made very thin, practically any material can be measured, even metallic or superconducting films. In this case the dielectric properties of the substrate are measured beforehand. In a second step the transmissivity and the phase shift of the film on the substrate are measured in a usual way described above and then the film properties can be extracted from these spectra by using the expressions for complex transmission coefficient of the two-layered system (film on the substrate). An example of such measurement is shown in the Fig.7.

Here the radiation is focused on the sample by a metallic parabolic mirror. Using a semi-transparent wire-grid beamsplitter the intensity is recorded versus frequency by the detector after been reflected off the plane sample and off the reference mirror. The reflection coefficient is obtained by division of the two data arrays. For the these measurements a special reflection unit is employed. In Fig. 9 we show a typical example of direct measurement of reflection coefficient at THz frequencies performed within the range of one BWO.
References
- G. Kozlov, A. Volkov, Coherent Source Submillimeter Wave Spectroscopy, in Millimeter and Submillimeter Spectroscopy of Solids, Ed. by G.Grüner (Topics in Applied Physics, vol.74, Springer Verlag, Berlin Heidelberg, 1998)
- M. Born, E. Wolf. Principles of Optics (Pergamon Press, Oxford 1986)
- B. Gorshunov et al., Solid State Commun. 60, 681 (1986)
- B. Gorshunov, N. Sluchanko, A. Volkov, M. Dressel, G. Knebel, A. Loidl, and S. Kunii, Phys. Rev. B 59 1808 (1999)
- A.V. Pronin, M. Dressel, A. Pimenov, A. Loidl, I.V. Roshchin, and L.H. Greene, Phys.Rev. B 57, 14416 (1998)
Contact

Artem Pronin
PD Dr.Optical studies of topological materials

Martin Dressel
Prof. Dr. rer. nat.Head of Institute