
About the method
Electron spin resonance (ESR), also known as Electron Paramagnetic Resonance (EPR), is a microscopic spectroscopy technique. It was first used by the soviet physicist Evgenii Konstantinovich Zavoisky in 1944. Any system that has unpaired electrons is, in principle, suitable to be investigated by ESR. Free radicals, defects, paramagnetic molecules (as NO, NO2), d and f transition metals, conduction electrons are examples of systems where unpaired electrons leads to ESR signal.

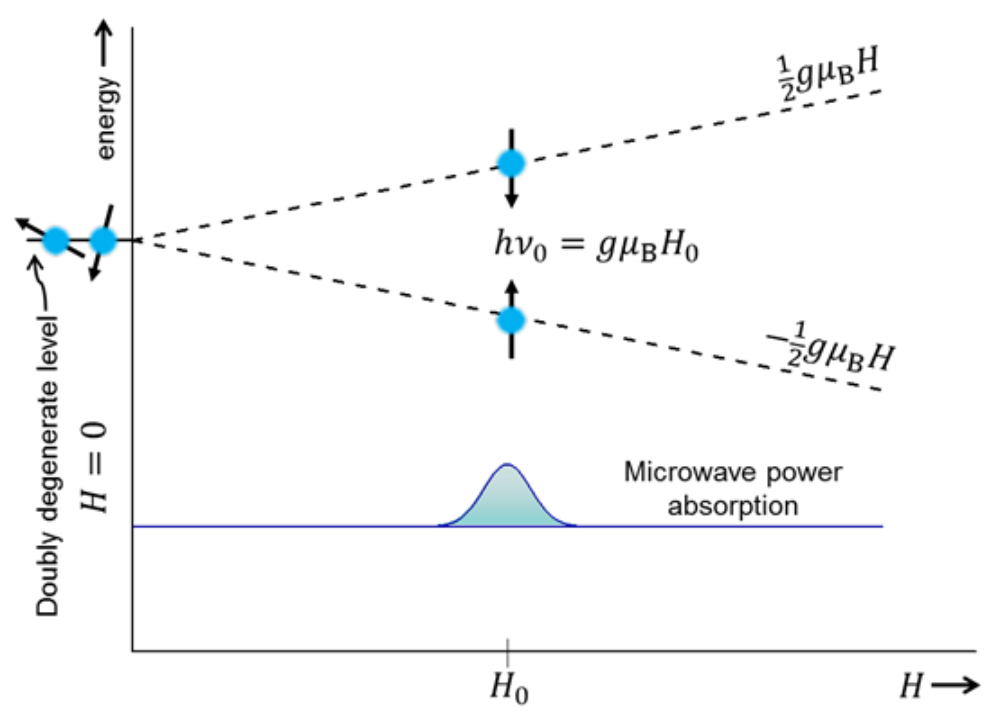
ESR is called a microscopic technique due to its ability to give unique information about processes at the atomic level. The term resonance indicates that one has to match a natural frequency of the system. Usually this frequency is given by the splitting of Zeeman levels. For the simplest case of a magnetic moment due to a spin ½ Fig. 1 illustrates the ESR absorption.
Detailed description
The sample (magnetic moments) is exposed to an oscillating magnetic field with fixed frequency, ν0, typically in the microwave range (GHz). A magnetic field, , is applied in order to tune the splitting of the Zeeman levels. When this splitting matches the energy of the microwave energy (H=H0 ), the oscillating magnetic field induces transitions between the Zeeman levels resulting in an absorption of microwave power by the sample. The amplitude of magnetic moment due to a spin ½ is ½gμB, where is a constant of proportionality called g-value and is the electronic Bohr magneton.
The g-value is the main parameter given by an ESR measurement. It gives information about the local symmetry, valence state of given ion, local internal fields experienced by the magnetic moment. In a more general case the magnetic moment has also contribution from orbital angular momentum and then local crystal electrical fields can be quantified by the measurement of g-tensor (g-value anisotropic).
The relaxation process responsible for the recovery of thermal equilibrium between the magnetic moments themselves (spin-spin) and the lattice (spin-lattice) is also obtained by ESR. It reflects directly the dynamic behavior of the probed magnetic moments revealing the nature of the interaction of these magnetic moments with the lattice (phonons) and other magnetic moments in the sample.
The scheme shown in Fig. 1 illustrates what is called a continuous wave (cw) ESR experiment. If the relaxation processes are slow enough the ESR signal can be observed by applying short microwave pulses. The main advantage of the pulsed method is that one can obtain directly the relaxation times related to spin-spin and spin-lattice process separately, while in the continuous wave they are indirectly estimated from the line width of the absorption line. In metals and magnetic materials the relaxation processes are too fast to be measured by pulsed method. Usually insulators and light element materials (organic, polymers) are suitable for pulsed measurements.
A standard cw ESR spectrometer consists of a microwave source, a resonant cavity (Fig. 2b), an electromagnet (Fig. 2a), power supply with field control, a field modulator and a detector diode and a lock-in-amplifier. The main part of the source is a vacuum tube with electron emitting cathode, resonator anode and reflector cathode, producing microwave oscillations in a small range of frequencies (Gunn diode). A wave-guide (Fig. 2a) transmits the microwaves to the resonator cavity in which the sample is placed. Coupling the wave-guide, which is a rectangular pipe used to carry microwaves, to the resonator can be achieved by means of a tunable coupling hole or iris (Fig. 2c). The iris accomplishes this by carefully matching the impedances (the resistance to the waves) of the cavity and the waveguide. The microwave power is directed from the source to the resonator through a circulator, which simultaneously redirects the reflected power to the detector. To improve the signal-to-noise ratio, a small amplitude field modulation (kHz range) is introduced. The resulting signal is rectified by lock-In technique. At the resonance condition, the modulation field is swept back and forth through a part of the ESR signal leading to transforming the signal into a sine wave with amplitude proportional to the slope of the resonance line (Fig. 2d).
